Armed group maps

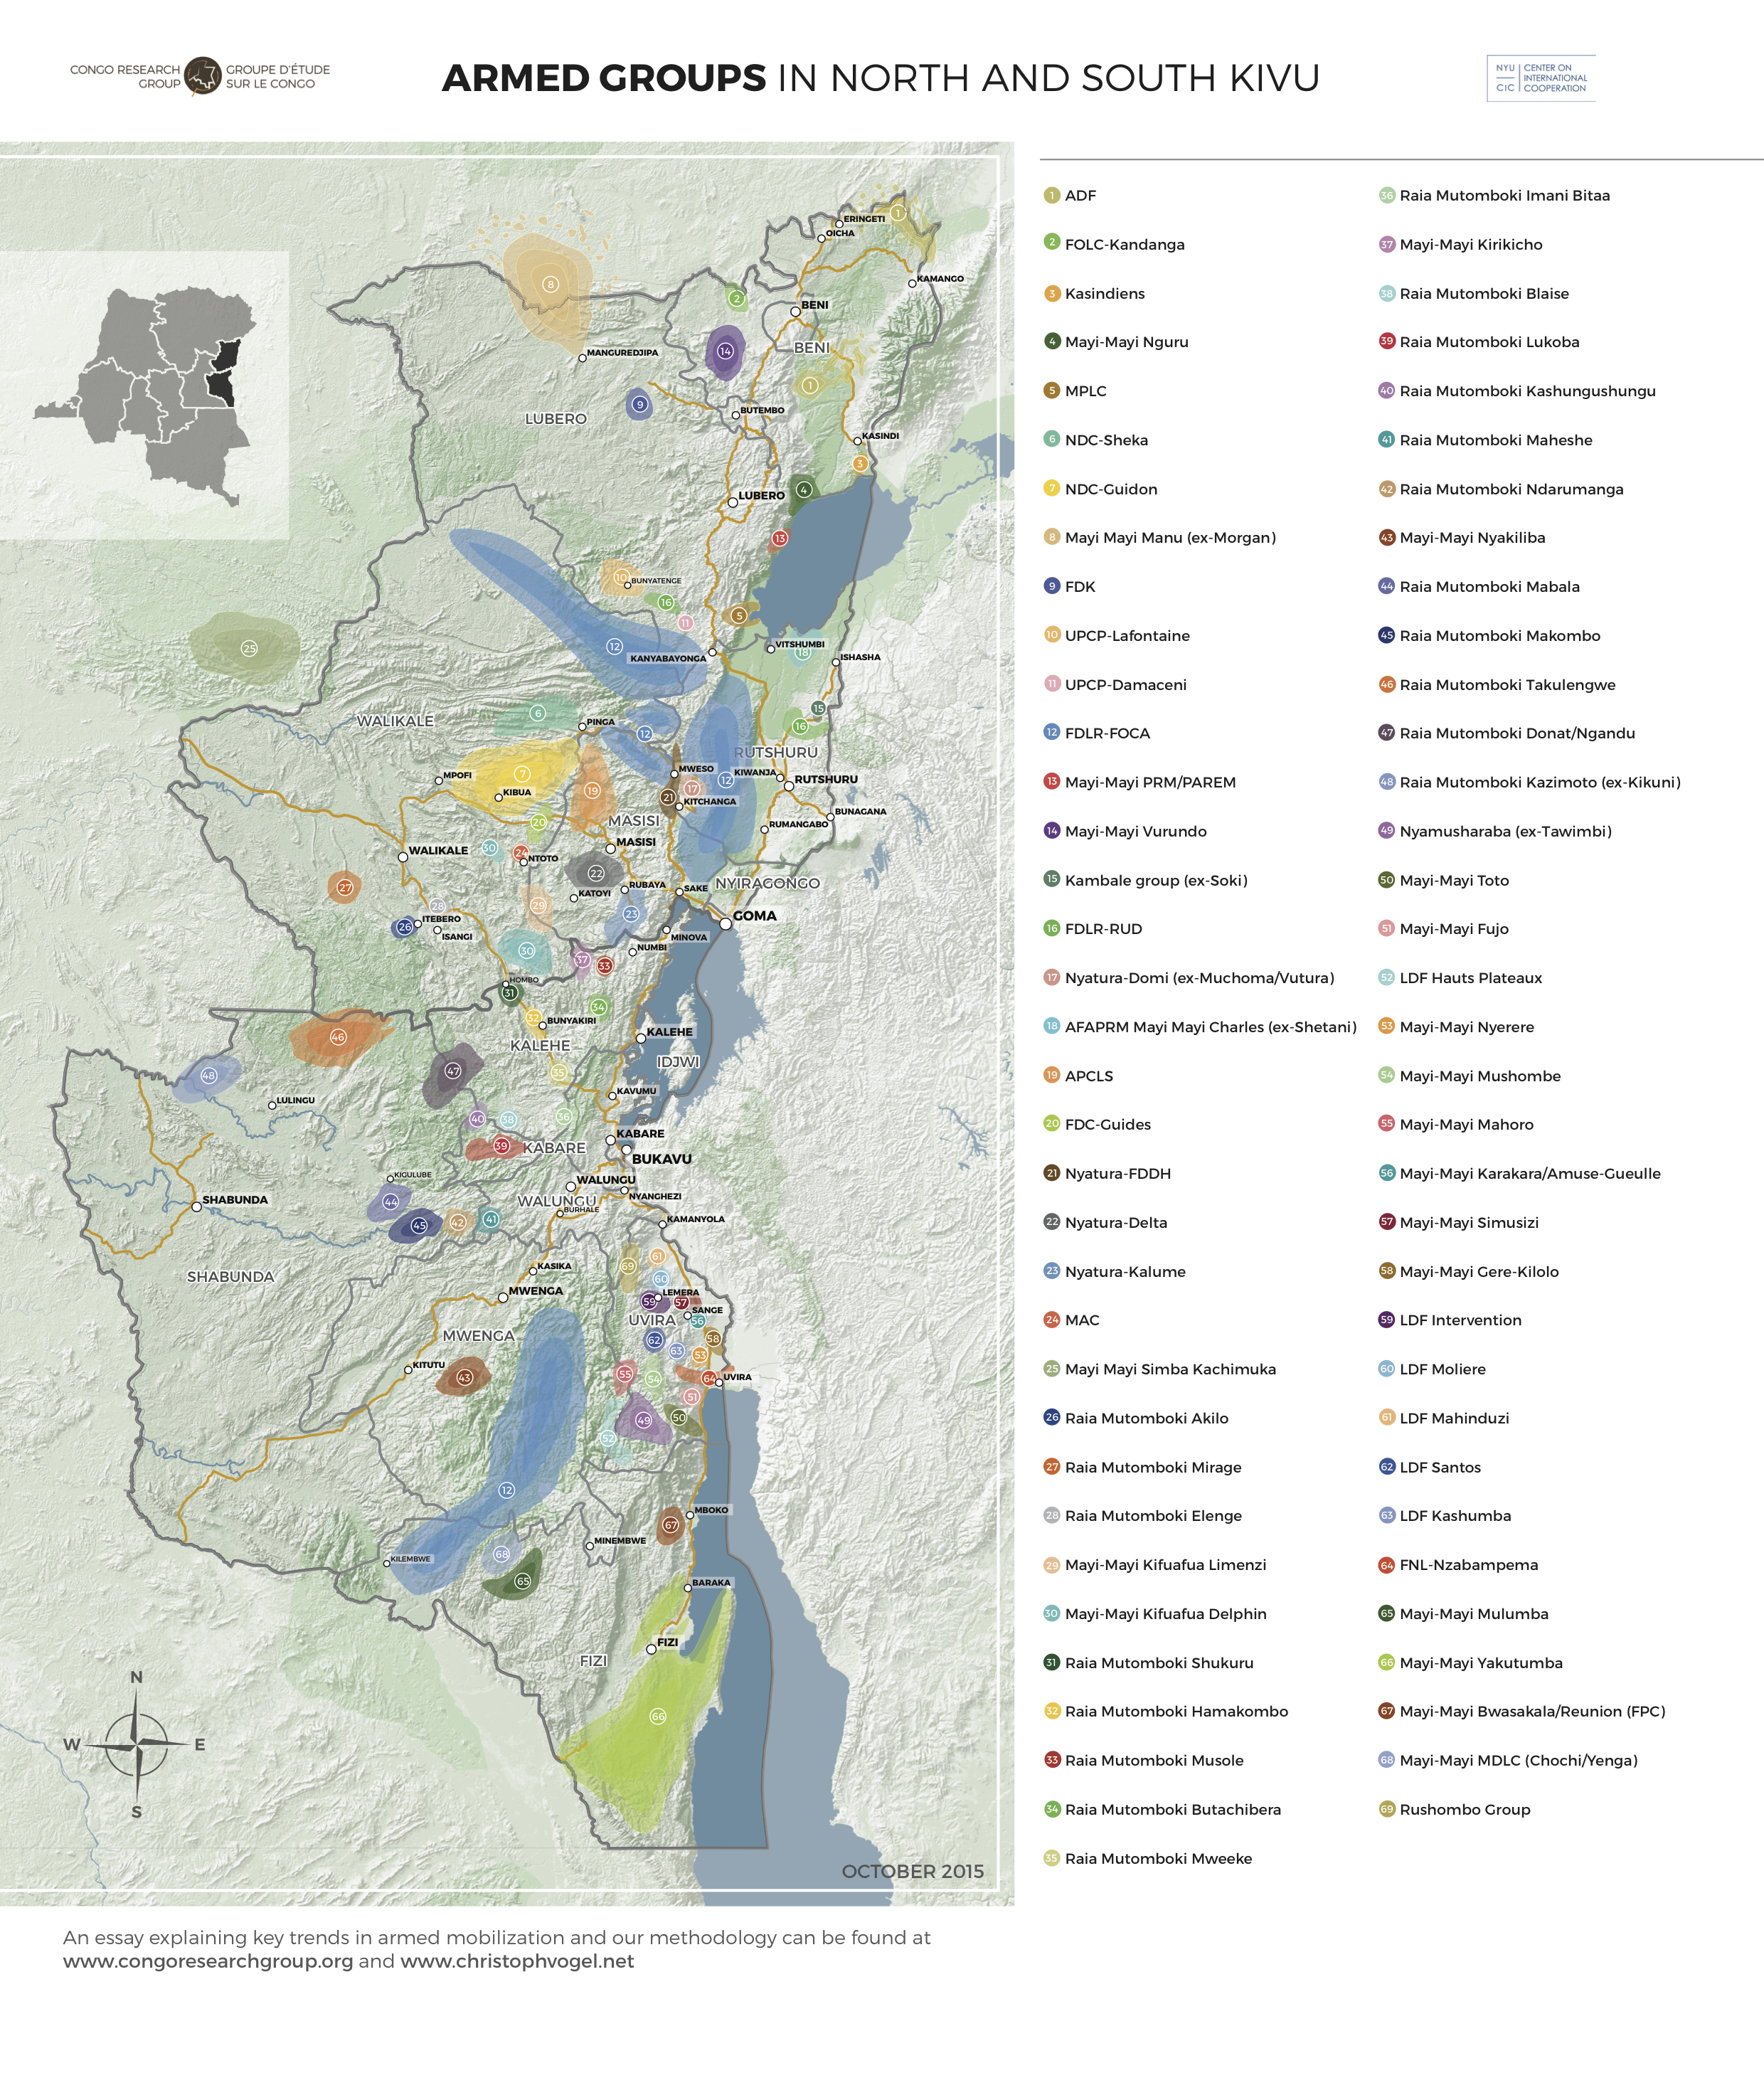
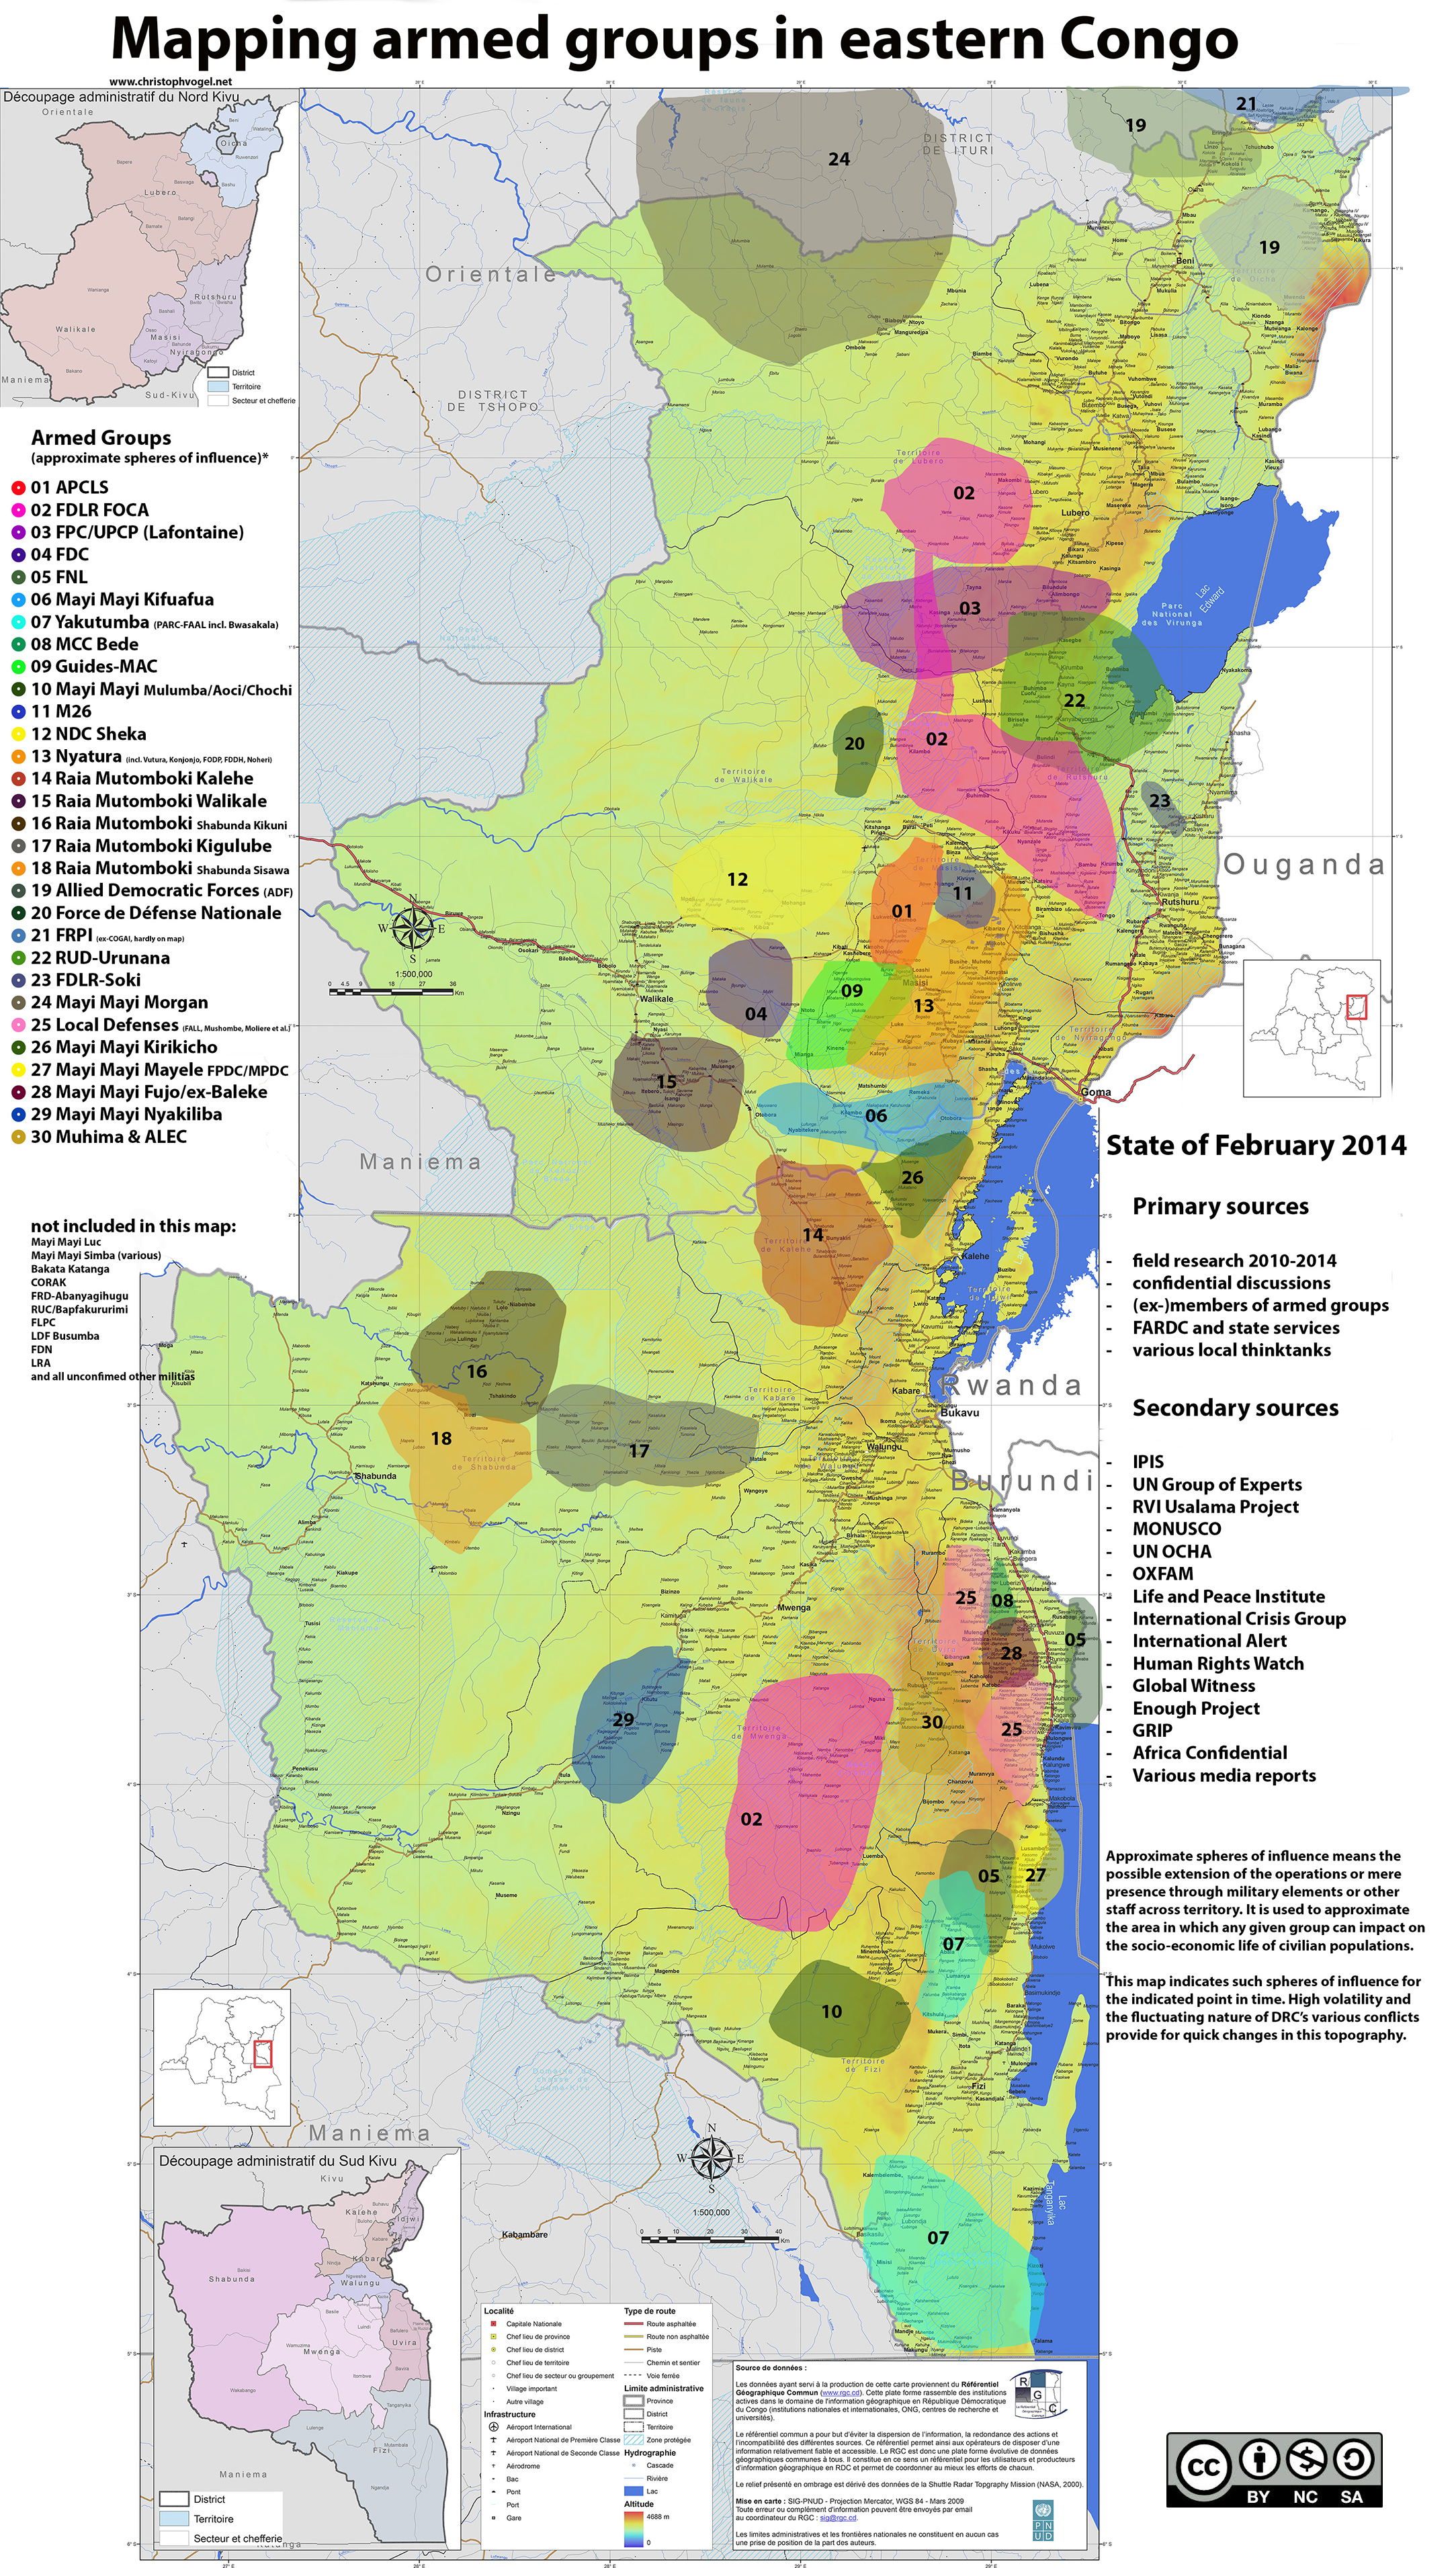
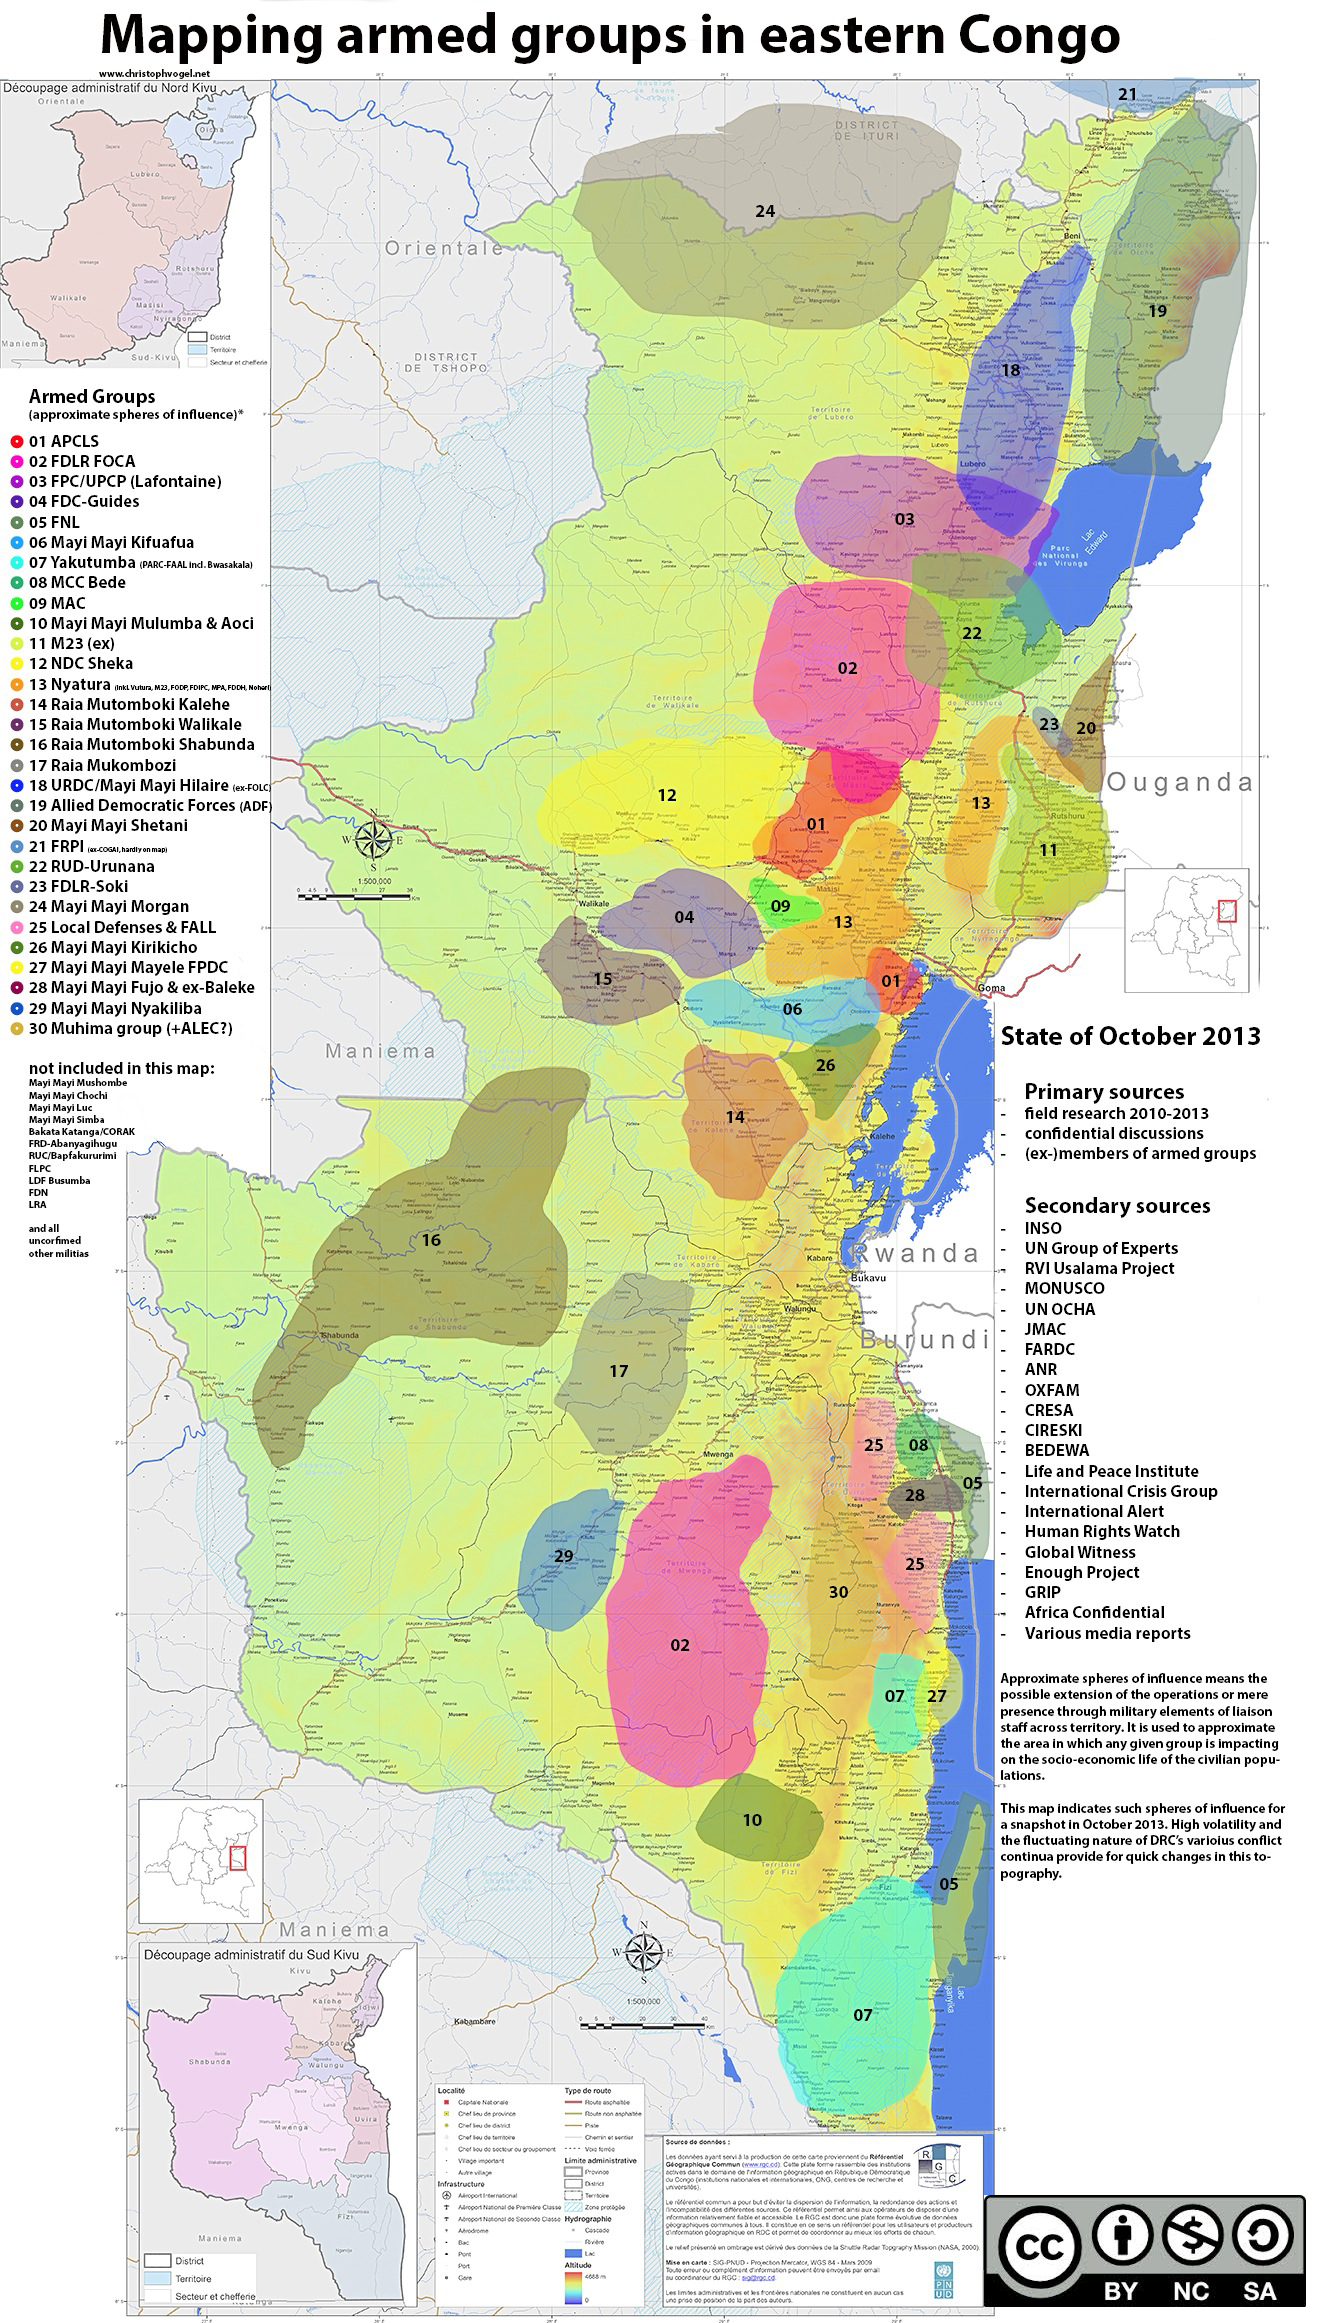
The suluhu armed group mappings covering eastern Congo’s Kivu provinces have begun in mid-2013. The latest and sixth edition covers the situation by late 2017. Since 2015, suluhu collaborates with the Congo Research Group and the Kivu Security Tracker to further enhance accuracy and visual presentation.

October 2020

KST AGs FULL 2020 en

October 2017


October 2015

CRG Mapping

________

Notes on the below, older mapping exercises:

The indicated areas represent zones of influence, not necessarily full control, for the indicated snapshots, i.e. points of time (click on the respective maps to see in full size). Changes in the subsequent maps reflect either changes on the ground or (for the time being) refinements relating to improved information. This exercise does not entail any claim of full accuracy and merely represents an approximate assessment of the situation with uncertainty and potential errors always remaining.

Winter 2014

GA Mapping IV 3

Summer 2014

GA Mapping III 7

Winter 2013

GA Mapping II 5 copy

Summer 2013

GA Mapping 16 copy

Comments
8 Responses to “Armed group maps”
  1. Stanley says:

    Hi Christophe. Can you assist me to get update Armed Group shapefiles (2017 North and South Kivu). I am a PhD student on violent conflicts GLR.

  2. Camille says:

    Dear Mr, will you please tell me how did you collect your information, your sources?
    Camille

  3. Anthony Bonhommeau says:

    Salut Christoph, il serait bien d’étendre les cartes à d’autres régions comme l’ex katanga et ou l’ex P-O. Anthony ancien coordo Puc.
    Amicalement

Trackbacks
Check out what others are saying...
  1. […] lisant par exemple le rapport de mapping des groupes rebelles de l’Est de la RDC publié par Suluhu, dans sa sixième édition de la cartographie Suluhu couvrant la situation de […]

  2. […] schemes to explain theinformal “economies of violence” generated by competition among at least 132 militias in North and South Kivu, at last […]

  3. […] schemes to explain theinformal “economies of violence” generated by competition among at least 132 militias in North and South Kivu, at last […]

  4. […] schemes to explain theinformal “economies of violence” generated by competition among at least 132 militias in North and South Kivu, at last […]

  5. […] Lien actualisé de la cartographie générale du conflit de l’Est de la RDC: http://christophvogel.net/congo/mapping/ […]


Leave a Reply

Fill in your details below or click an icon to log in:

WordPress.com Logo

You are commenting using your WordPress.com account. Log Out /  Change )

Facebook photo

You are commenting using your Facebook account. Log Out /  Change )

Connecting to %s

%d bloggers like this: